



| ISIN | (Serie A)ES0106079033(Serie B)ES0106079009 | Net Asset Value 6,525062 € | 1D Return (%) 0 | Profitability in 2017 (%) 3,59% | Valuation Date 15/09/2017 | Registry No. | 3449 |
(*) Important Notice: this is the last Net Asset Value (NAV) published by Amundi Iberia SGIIC, S.A.. EVOLUTION INVESTMENT SICAV, S.A. merged with KALYANI SICAV, S.A. as of 19/09/2017. The merger was completed as of 6/10/2017, as figures in the files of the Mercantile Registry of Madrid. The SICAV was unlisted as of 25/10/2017 at the Alternative Madrid Stock Exchange (MaB).
INVESTMENT POLICY.
The origin of Evolution Investment Sicav, S.A. It's a mandate given to Cross Capital and Banco Madrid AM, by the famous investor Mr. Ram Bhavnani in October 2012. The Sicav has a global investment approach, where we apply our multiasset style investing, flexible allocation and an absolute return focus, with a fixed target of a 5% annual performance. The risk profile is moderate and it seeks capital preservation and consistent annual return generation in any cycle.
The Sicav allows total flexibility in terms of exposure to the different asset classes; however, in practical terms, due to the risk policy, the maximum exposure to equtiy is 75% of total assets. The rest it's invested in fixed income, public and corporate, an also in other financial assets via mutual funds and/or ETFs (Exchage Traded Funds). Geographically, the investments are located fundamentally in United States and Europe.
The investment focus applied, allows the investor taking benefit of the global macro trends, with a bottom-up security selection, for equities but also for the fixed income, applying a 'value investing' based approach. The risk control is rigorous, fixing a maximum exposure to high yield of 75% of the total fixed income arm. The maximum duration is 15 years, taking care of the equilibrium between small-mid and large caps, and limiting the maximum exposure to Emerging Markets to 15% of total assets. Risk is also controlled in terms of individual concentration and diversification (number of positions). Derivatives are used basically for hedging purpposes. The exposure to non Euro currencies could be 100%. The investment method has been used and proven by Cross Capital's team for more than 15 years, knowhow that currently is complemented by Amundi Iberia SGIIC, S.A..
The recommended investment period is at least 5 years. It's a pioneer Sicav in Spain, due to it's two series of shares: one for institutional/professional investors (serie A) and other for retail investors (serie B). In February 2016, due to it's trackrecord and risk-return achived since inception, the Sicav was rated with 4 stars by Morningstar.
It's not a benchmark driven portfolio management, due to it's absolute return objective, fixed in 5% annual.

MAIN FEATURES.

NET ASSET VALUE (NAV)
PERFORMANCE.
| Annual | January | February | March | April | May | June | July | August | September | October | November | December | |
|---|---|---|---|---|---|---|---|---|---|---|---|---|---|
| 2017 | 3,27% | 0,76% | 1,85% | 0,63% | 0,56% | 0,54% | -1,15% | 0,36% | -1,30% | – | – | – | – |
| 2016 | 1,49% | -4,02% | -0,77% | 2,17% | 0,50% | 1,72% | -2,90% | 2,17% | 0,02% | -0,29% | -0,14% | 0,09% | 3,15% |
| 2015 | 4,97% | 4,63% | 2,94% | 1,70% | -0,43% | 0,21% | -1,58% | 0,30% | -4,53% | -1,50% | 4,82% | 1,18% | -2,45% |
| 2014 | 6,37% | -1,35% | 2,48% | -0,15% | 0,87% | 1,97% | 0,15% | -0,55% | 1,67% | -0,12% | 0,45% | 1,26% | -0,40% |
| 2013 | 10,81% | 0,75% | 1,34% | 0,23% | 1,64% | 0,76% | -2,69% | 2,62% | -1,05% | 2,28% | 3,15% | 0,86% | 0,58% |
| 2012 | 2,30% | – | – | – | – | – | – | – | – | – | -0,30% | 1,36% | 1,21% |
*Data as of August 2018
| Annual | January | February | March | April | May | June | |
|---|---|---|---|---|---|---|---|
| 2017 | 2,62% | 0,76% | 1,85% | 0,63% | 0,56% | 0,54% | -1,15% |
| 2016 | 1,49% | -4,02% | -0,77% | 2,17% | 0,50% | 1,72% | -2,90% |
| 2015 | 4,97% | 4,63% | 2,94% | 1,70% | -0,43% | 0,21% | -1,58% |
| 2014 | 6,37% | -1,35% | 2,48% | -0,15% | 0,87% | 1,97% | 0,15% |
| 2013 | 10,81% | 0,75% | 1,34% | 0,23% | 1,64% | 0,76% | -2,69% |
| 2012 | 2,30% | – | – | – | – | – |
| July | August | September | October | November | December | |
|---|---|---|---|---|---|---|
| 2017 | 0,36% | -1,30 | – | – | – | – |
| 2016 | 2,17% | 0,02% | -0,29% | -0,14% | 0,09% | 3,15% |
| 2015 | 0,30% | -4,53% | -1,50% | 4,82% | 1,18% | -2,45% |
| 2014 | -0,55% | 1,67% | -0,12% | 0,45% | 1,26% | -0,40% |
| 2013 | 2,62% | -1,05% | 2,28% | 3,15% | 0,86% | 0,58% |
| 2012 | – | – | – | -0,3% | 1,36% | 1,21% |
*Data at the end of July 2017
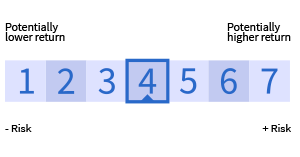
RISK AND RETURN.
| Performance | Anual Return | |
|---|---|---|
| 1 month | 0,36% | – |
| 3 months | 0,35% | – |
| 1 year | 7,48% | 7,48% |
| 3 years | 14,41% | 4,60% |
| 5 years | – | – |
| Since inception | 34,10% | 6,35% |
| Annualized Volatility (d) | Sharpe Ratio |
|---|---|
| 6,31% | 1,05 |
| Maximum Drawdown (12m) | VaR (95%/1m) |
| -3,21% | 3,51% |
PORTFOLIO DETAIL.
TOP HOLDINGS
| Altia Consultores SA | 6,82% |
| Carmignac Securite | 5,70% |
| (Venta) Fut. Euro Stoxx50 | 4,89% |
| (Venta) Fut. S&P500 | 2,34% |
| Nordea Stable Return | 2,12% |
CURRENCY EXPOSURE
| Euro | 62,47% |
| US Dollar | 24,25% |
| Other Developed Markets | 10,91% |
| Emerging Markets | 2,36% |
ASSET CLASS BREAKDOWN
RENTA VARIABLE
RENTA FIJA
A. MONET.
ALTERNATIVOS
17,43% MONEY MARKETS
28,15% FIXED INCOME
52,38% EQUITY
2,05% ALTERNATIVES
EQUITY EXPOSURE BY SECTOR
RENTA VARIABLE
FINANZAS
C. ESTABLE
C.DISCRECIONAL
INDUSTRIALES
MATERIALES
SALUD
INFRAESTRUCT.
TECNOLOGÍA
TMT
20,37% CONSUMER DISCRETIONARY
11,00% CONSUMER STAPLES
6,41% ENERGY
4,99% FINANCE
6,28% INDUSTRIALS
1,43% UTILITIES
4,17% MATERIALS
7,56% HEALTHCARE
29,92% IT
7,86% TMT
PRINCIPALES POSICIONES
| (Compra) Fut. EUR/USD | 8,41% |
| Altia Consultores | 6,36% |
| Carmignac Securite | 5,65% |
| (Compra) Fut. Euro Stoxx 50 | 4,84% |
| Naspers | 2,38% |
EXPOSICIÓN A DIVISAS
| Euro | 59,327% |
| Dólar Estadounidense | 30,58% |
| Resto Desarrollados | 7,89% |
| Mercados Emergentes | 2,21% |
COMPOSICIÓN POR CLASE DE ACTIVOS
17,43% ACTIVOS MONET.
28,15% RENTA FIJA
52,38% RENTA VARIABLE
2,05% ALTERNATIVOS
DISTRIBUCIÓN SECTORIAL RENTA VARIABLE
[wp_charts title='mydough' type='doughnut' align='alignleft' margin='5px 20px' data='30,10,55,25,15,8' colors='69D2E7,#E0E4CC,#F38630,#96CE7F,#CEBC17,#CE4264']
20,37% CONSUMO DISCRECIONAL
11,00% CONSUMO ESTABLE
6,41% ENERGÍA
4,99% FINANZAS
6,28% INDUSTRIALES
1,43% INFRAESTRUCTURAS
4,17% MATERIALES
7,56% SALUD
29,92% TECNOLOGÍA
7,86% TMT